Among the many options available within RideAmigos that can be used for analysis and planning, one of the most interesting and useful tools is our heatmap reporting.
Site Administrators: Manage > System Reports | Tripplans/Trip Searches
To explore heatmaps, start by clicking Tools >>> System Reporting, then selecting System TripPlans or System Trip Searches.
Trip Plans will display origin and destination data for trips users have saved into the system as commutes, rideshare routes, bikepool routes, etc.
Trip Searches will display origin and destination data for searches initiated by users.
Next, click the icon in the top right of the map then select Heatmap – Origins or Heatmap – Destinations.
Your map will immediately switch to heatmap mode. Depending on your monitor, you may find it easier to view heatmaps by choosing different base map options.
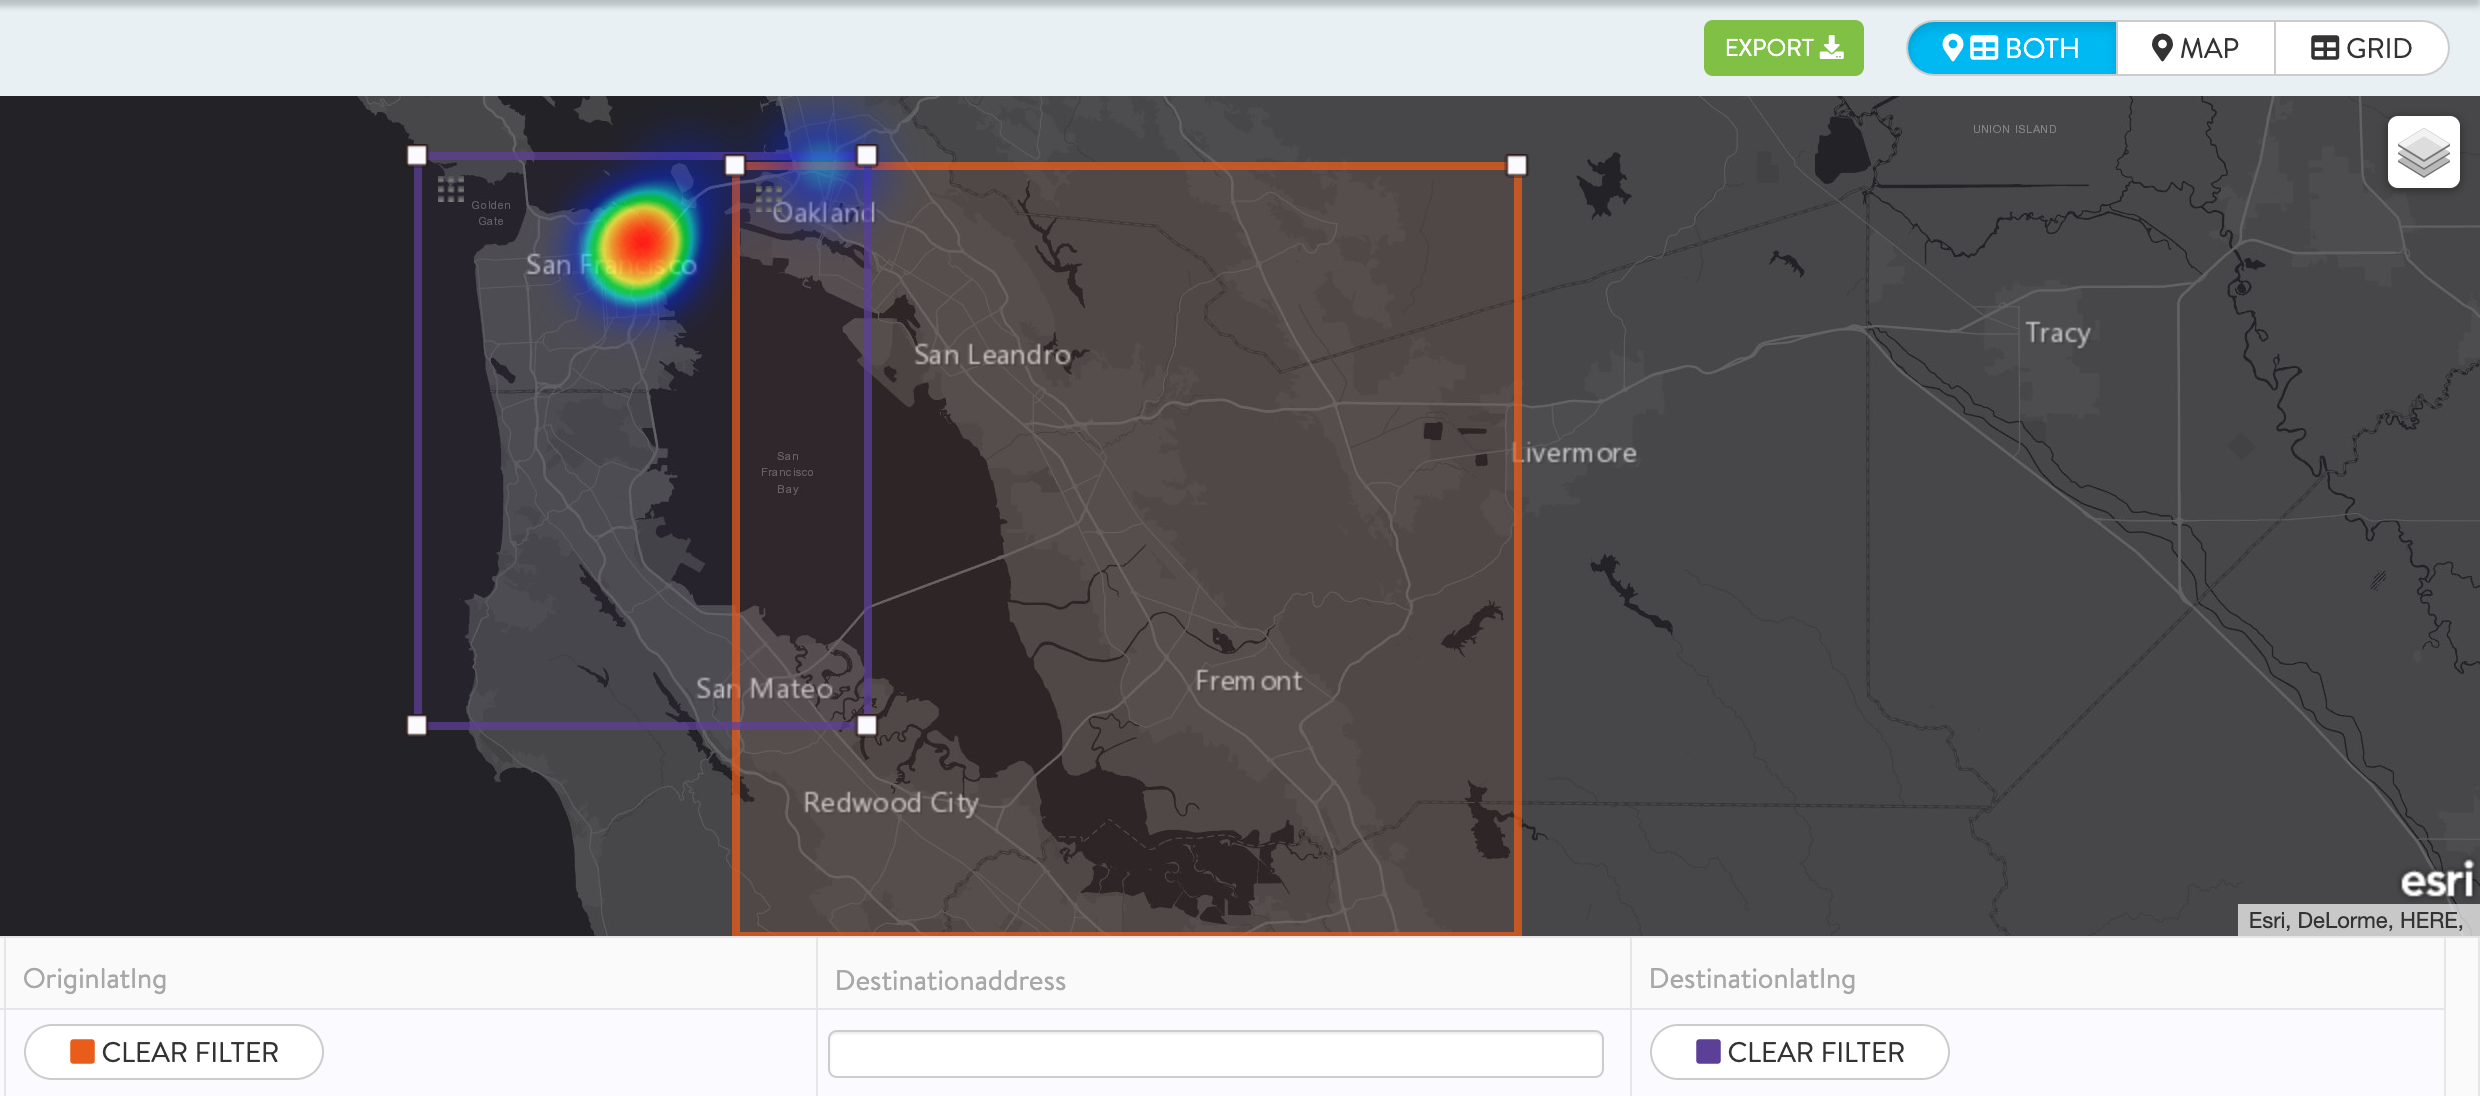
Similar to cluster maps, heatmaps are a powerful way to identify concentrations of common origins and destinations. But unlike clusters, heatmaps allow easier visualization of specific densities in specific areas.
All the advanced filtering options available with RideAmigos are accessible within heatmaps, exponentially increasing their power. Filters can be set in either the Both or Grid views.
For example, you can easily view heatmaps for specific networks.
Of particular usefulness are the Originlatlng and Destinationlatlng filters, which allow you to draw boxes around areas of interest on the heatmap.
Click Select on Map for either of these filters, use the drag-n-drop boxes to move and resize your filter area, then click Filter to apply the filter.

Using the heatmap you can easily identify groups of users who share common origins and destinations, allowing you to tailor your programs and suggestions to those specific groups.
Once you’ve filtered a list you would like to export, click the green Export button at the top right and choose which file format (Excel or GeoJSON) you would like to download.